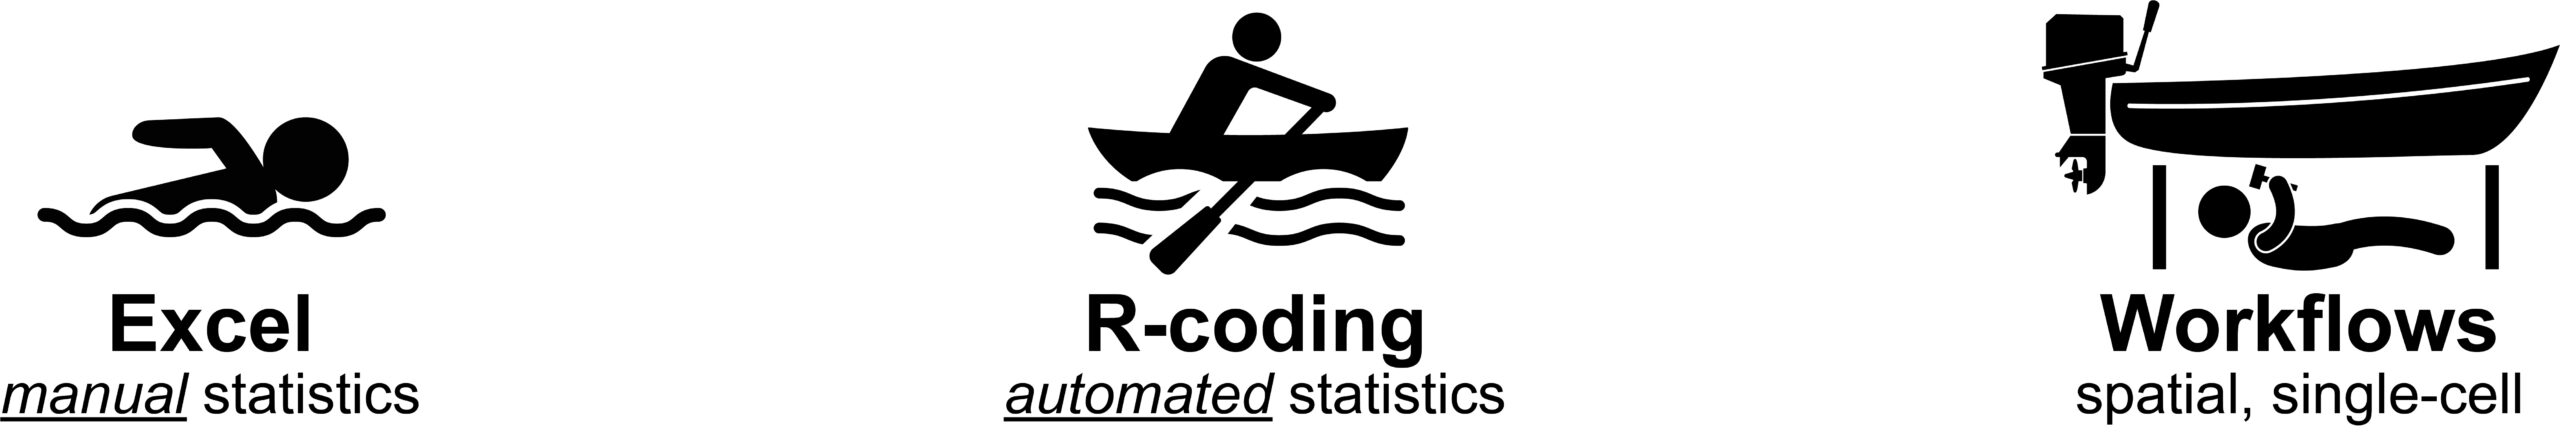
This course is designed to build practical data skills by starting with familiar tools and topics. We begin in Excel, using intuitive datasets—like movies, music, and foods—to teach core statistical concepts and analysis methods. These relatable examples help students focus on learning techniques rather than decoding unfamiliar data. In the second section, students transition to the R programming language, using code to automate and scale the same analyses. The third section revisits core biology concepts through a data lens, and the final section introduces advanced methods like single-cell and spatial transcriptomics. Returning to our “drowning in data” analogy: students first learn to swim in Excel, sail with R, and ultimately navigate deep waters using modern bioinformatics tools.
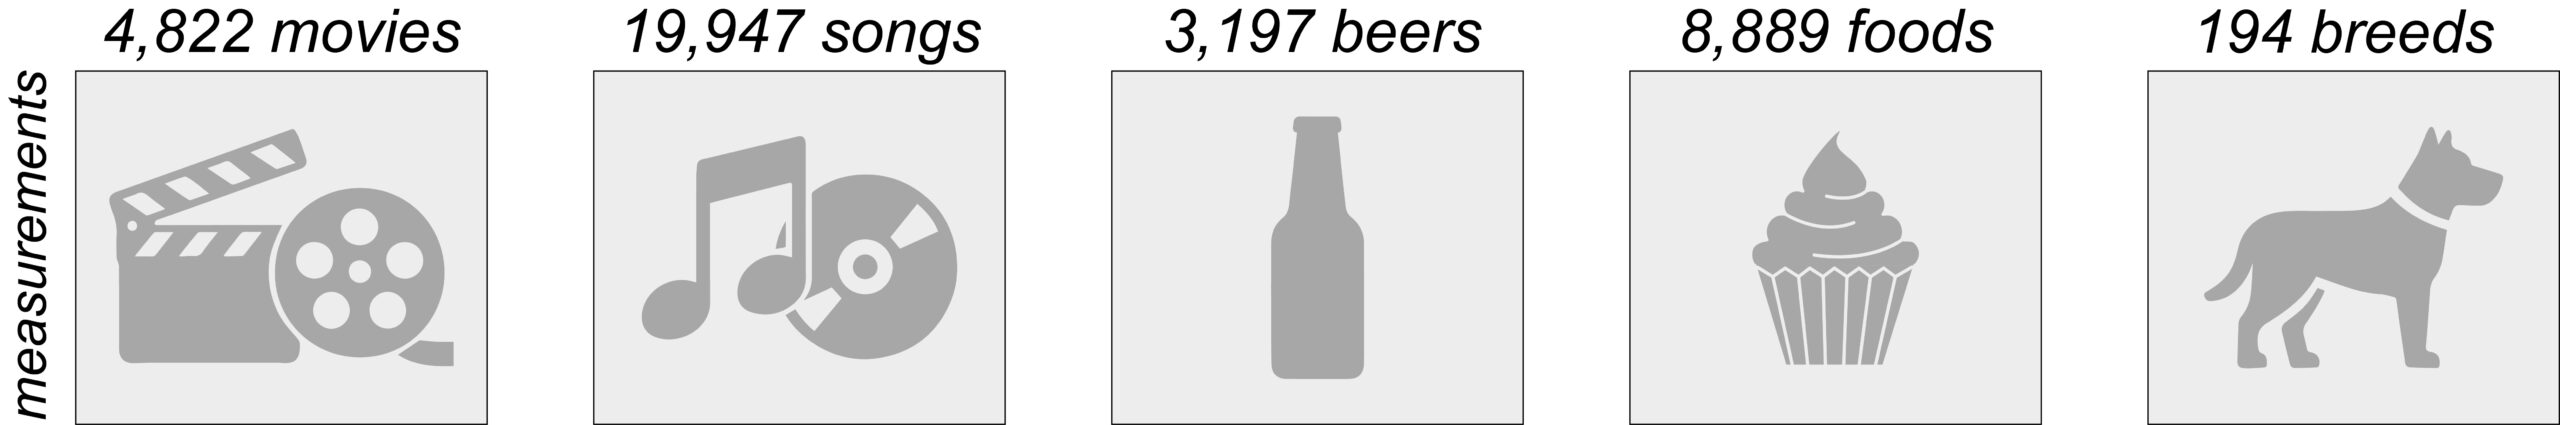
To make statistical concepts more approachable, the course begins with a set of familiar and intuitive datasets. These include matrices on dog breeds (behavioral traits), Spotify songs (audio features), popular foods (nutritional content), U.S. beers (taste and alcohol metrics), and movies (box office and ratings data). By analyzing topics students already understand, we reduce the cognitive load and allow them to focus on learning key data analysis techniques. These same datasets are later revisited using R, easing the transition from Excel to coding.